Density estimation
Contours can show the estimated density of point clouds, which is useful to avoid overplotting in large datasets. The contourDensity method implements fast two-dimensional kernel density estimation.
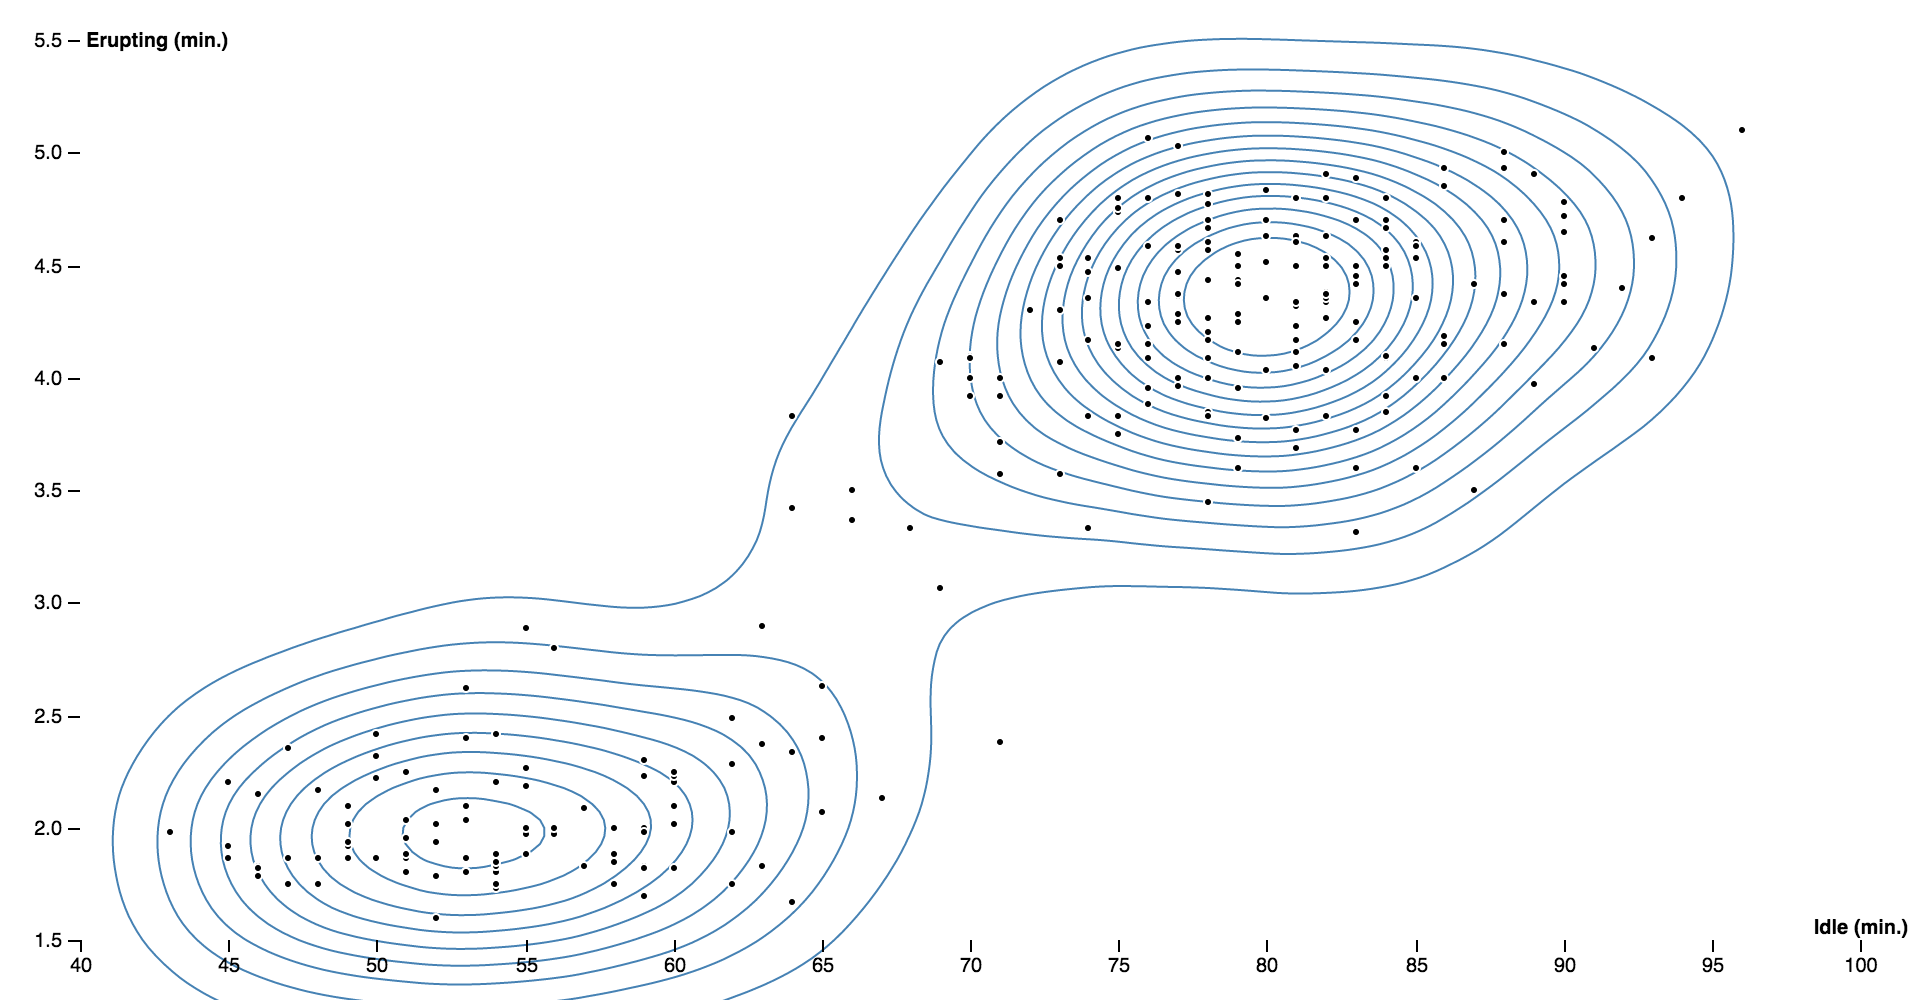
Here is a scatterplot showing the relationship between the idle duration and eruption duration for Old Faithful:
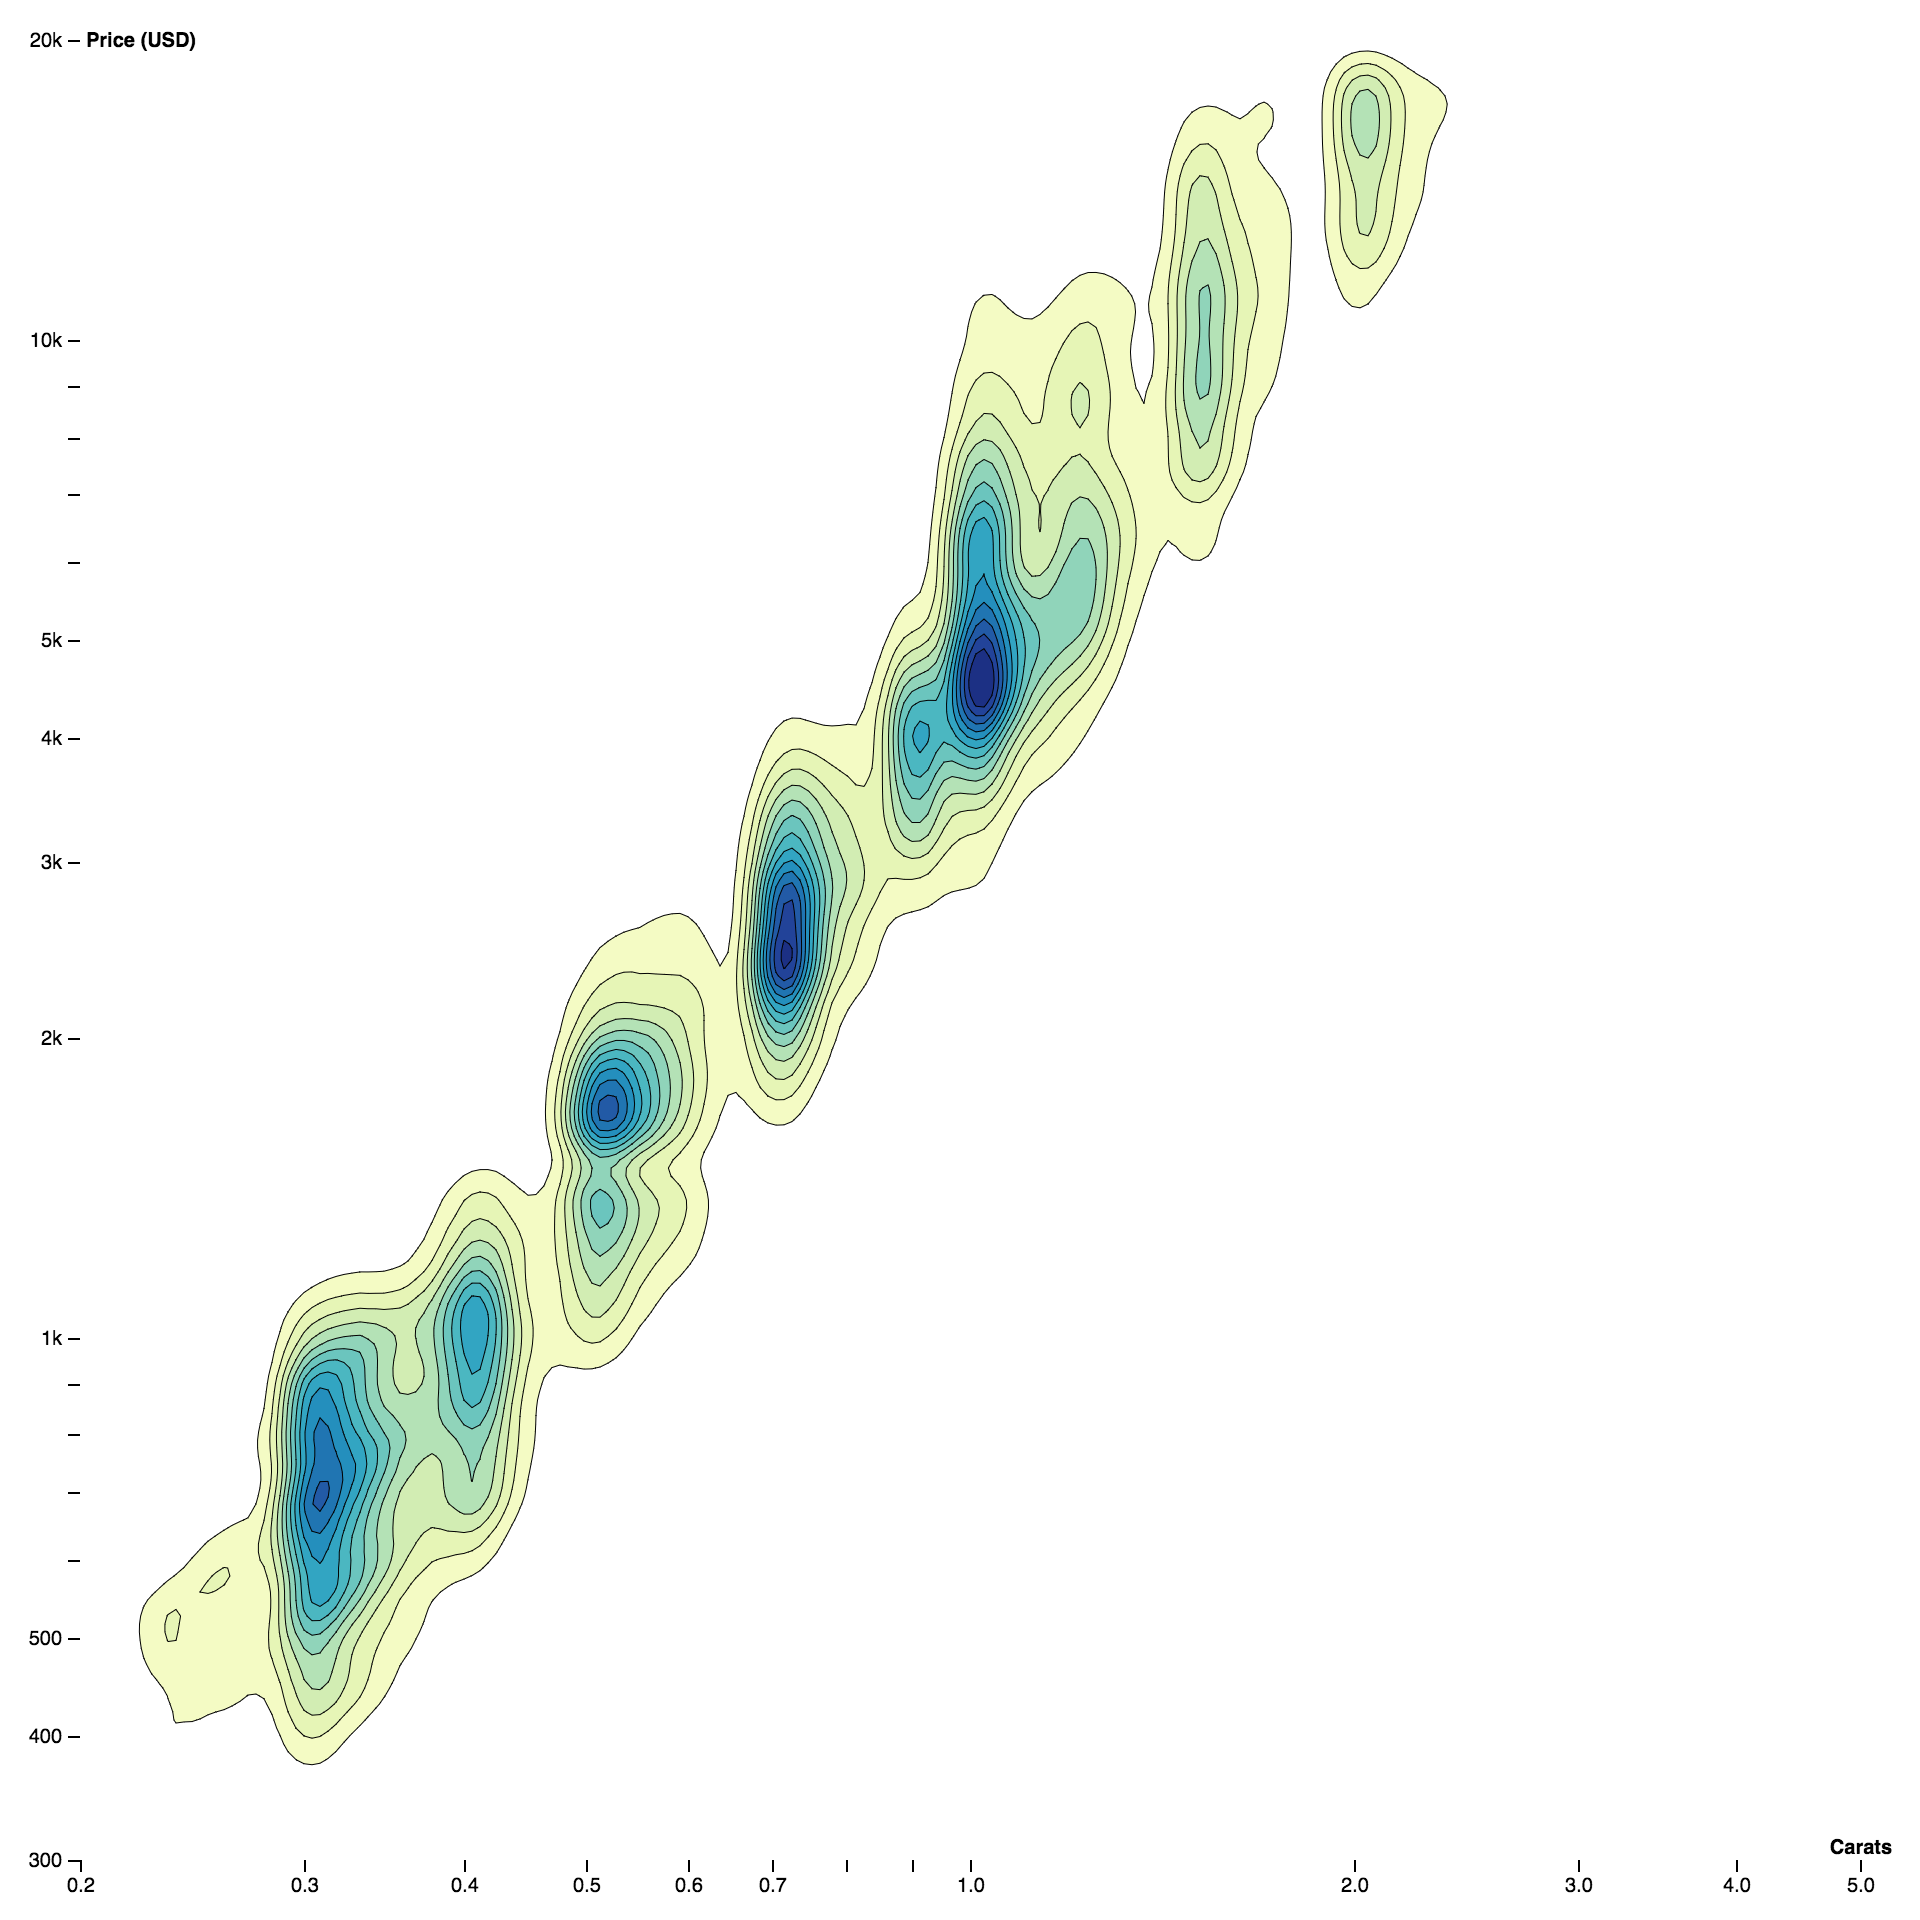
And here is a density contour plot showing the relationship between the weight and price of 53,940 diamonds:
contourDensity()
Examples · Source · Constructs a new density estimator with the default settings.
density(data)
Source · Estimates the density contours for the given array of data, returning an array of GeoJSON MultiPolygon geometry objects.
Each geometry object represents the area where the estimated number of points per square pixel is greater than or equal to the corresponding threshold value; the threshold value for each geometry object is exposed as geometry.value. The returned geometry objects are typically passed to geoPath to display, using null or geoIdentity as the associated projection. See also contours.
The x and y coordinate for each data point are computed using density.x and density.y. In addition, density.weight indicates the relative contribution of each data point (default 1). The generated contours are only accurate within the estimator’s defined size.
density.x(x)
Source · If x is specified, sets the x-coordinate accessor. If x is not specified, returns the current x-coordinate accessor, which defaults to:
function x(d) {
  return d[0];
}density.y(y)
Source · If y is specified, sets the y-coordinate accessor. If y is not specified, returns the current y-coordinate accessor, which defaults to:
function y(d) {
  return d[1];
}density.weight(weight)
Source · If weight is specified, sets the accessor for point weights. If weight is not specified, returns the current point weight accessor, which defaults to:
function weight() {
  return 1;
}density.size(size)
Source · If size is specified, sets the size of the density estimator to the specified bounds and returns the estimator. The size is specified as an array [width, height], where width is the maximum x-value and height is the maximum y-value. If size is not specified, returns the current size which defaults to [960, 500]. The estimated density contours are only accurate within the defined size.
density.cellSize(cellSize)
Source · If cellSize is specified, sets the size of individual cells in the underlying bin grid to the specified positive integer and returns the estimator. If cellSize is not specified, returns the current cell size, which defaults to 4. The cell size is rounded down to the nearest power of two. Smaller cells produce more detailed contour polygons, but are more expensive to compute.
density.thresholds(thresholds)
Source · If thresholds is specified, sets the threshold generator to the specified function or array and returns this contour generator. If thresholds is not specified, returns the current threshold generator, which by default generates about twenty nicely-rounded density thresholds.
Thresholds are defined as an array of values [x0, x1, …]. The first generated density contour corresponds to the area where the estimated density is greater than or equal to x0; the second contour corresponds to the area where the estimated density is greater than or equal to x1, and so on. Thus, there is exactly one generated MultiPolygon geometry object for each specified threshold value; the threshold value is exposed as geometry.value. The first value x0 should typically be greater than zero.
If a count is specified instead of an array of thresholds, then approximately count uniformly-spaced nicely-rounded thresholds will be generated; see ticks.
density.bandwidth(bandwidth)
Source · If bandwidth is specified, sets the bandwidth (the standard deviation) of the Gaussian kernel and returns the estimate. If bandwidth is not specified, returns the current bandwidth, which defaults to 20.4939…. The specified bandwidth is currently rounded to the nearest supported value by this implementation, and must be nonnegative.
density.contours(data)
Examples · Source · Return a contour(value) function that can be used to compute an arbitrary contour on the given data without needing to recompute the underlying grid. The returned contour function also exposes a contour.max value which represents the maximum density of the grid.