Contour polygons
For each threshold value, the contour generator constructs a GeoJSON MultiPolygon geometry object representing the area where the input values are greater than or equal to the threshold value. The geometry is in planar coordinates, where ⟨i + 0.5, j + 0.5⟩ corresponds to element i + jn in the input values array.
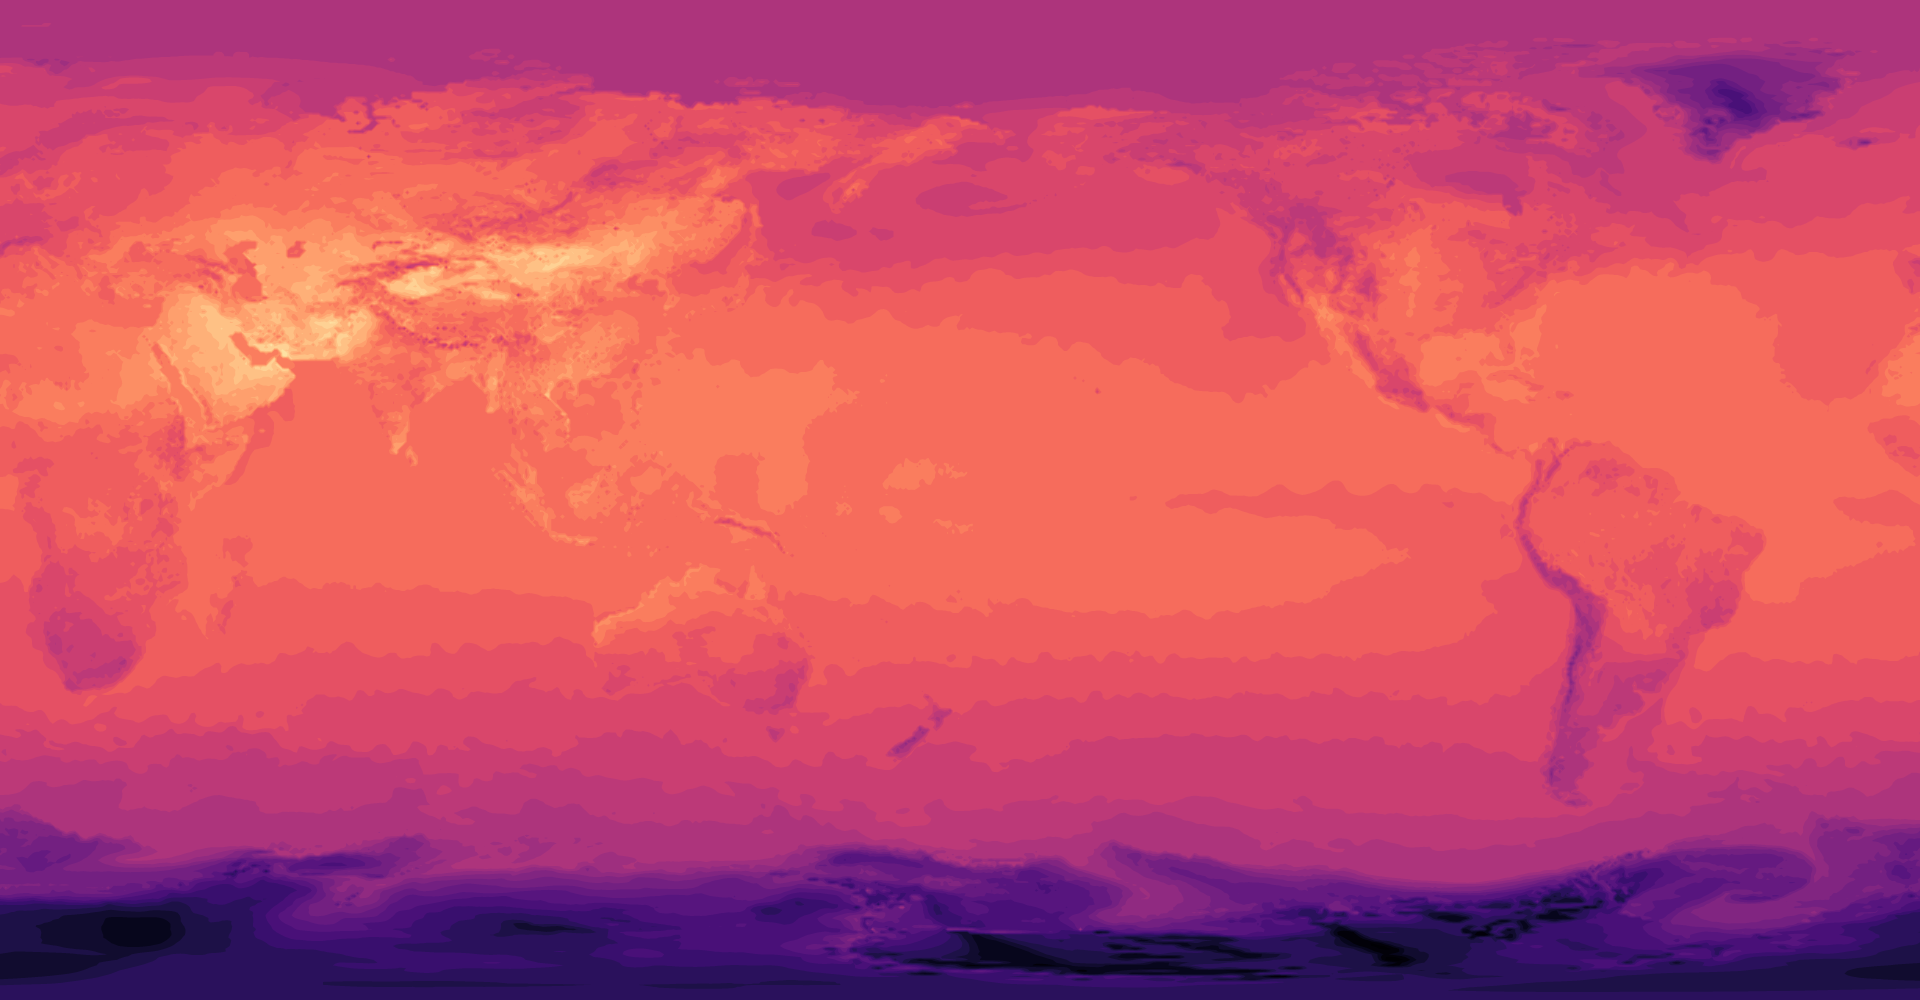
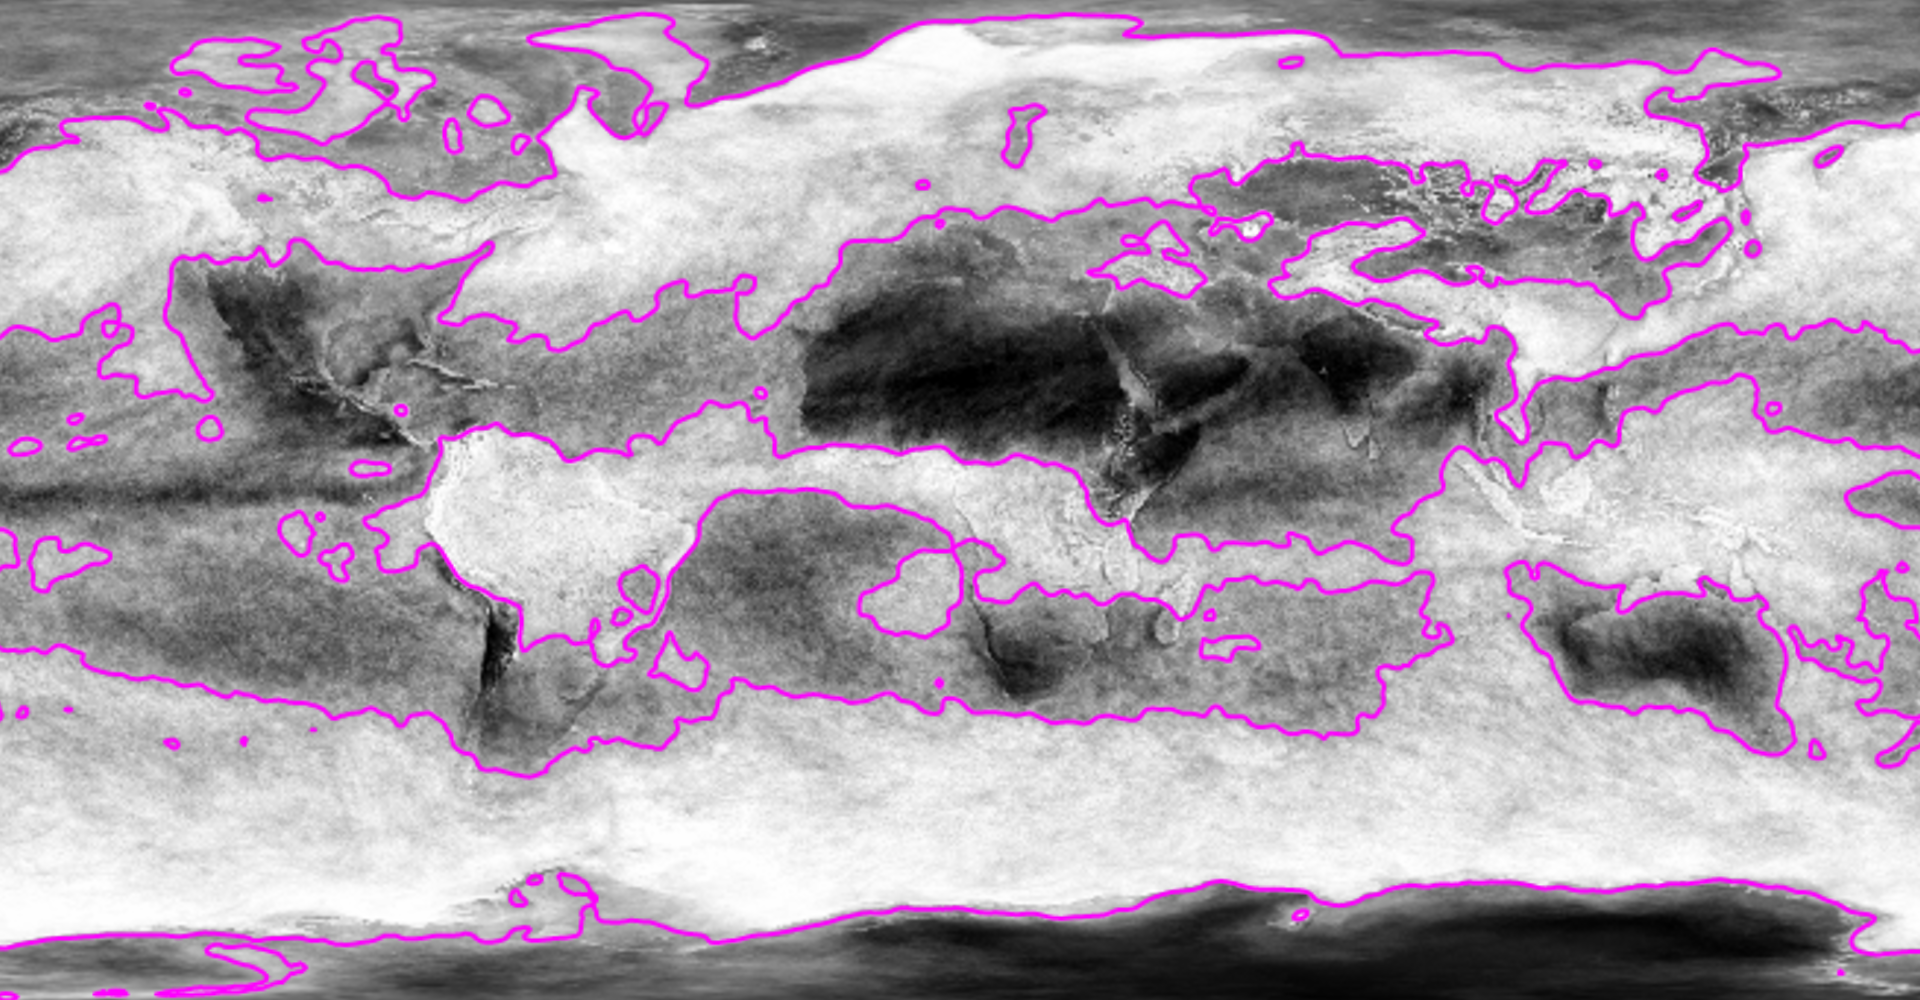
Here is an example that loads a GeoTIFF of surface temperatures, and another that blurs a noisy monochrome PNG to produce smooth contours of cloud fraction:
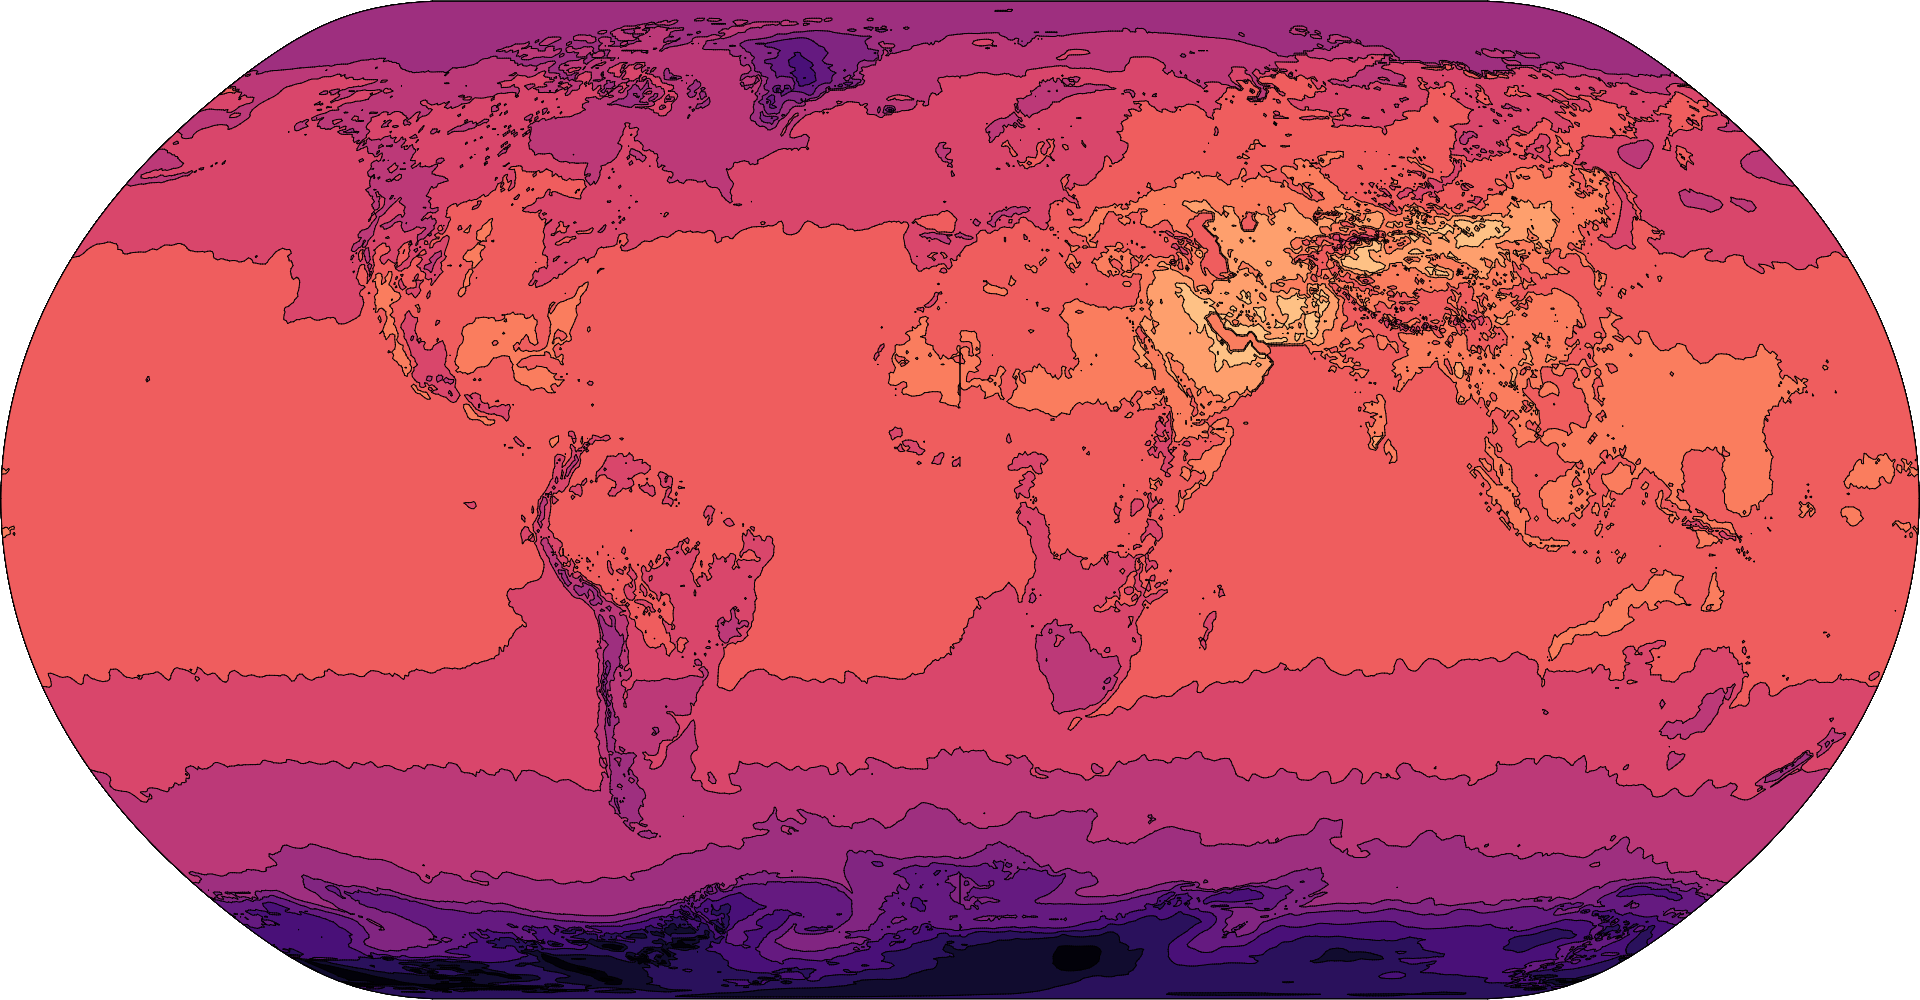
Since the contour polygons are GeoJSON, you can transform and display them using standard tools; see geoPath, geoProject and geoStitch, for example. Here the above contours of surface temperature are displayed in the Natural Earth projection:
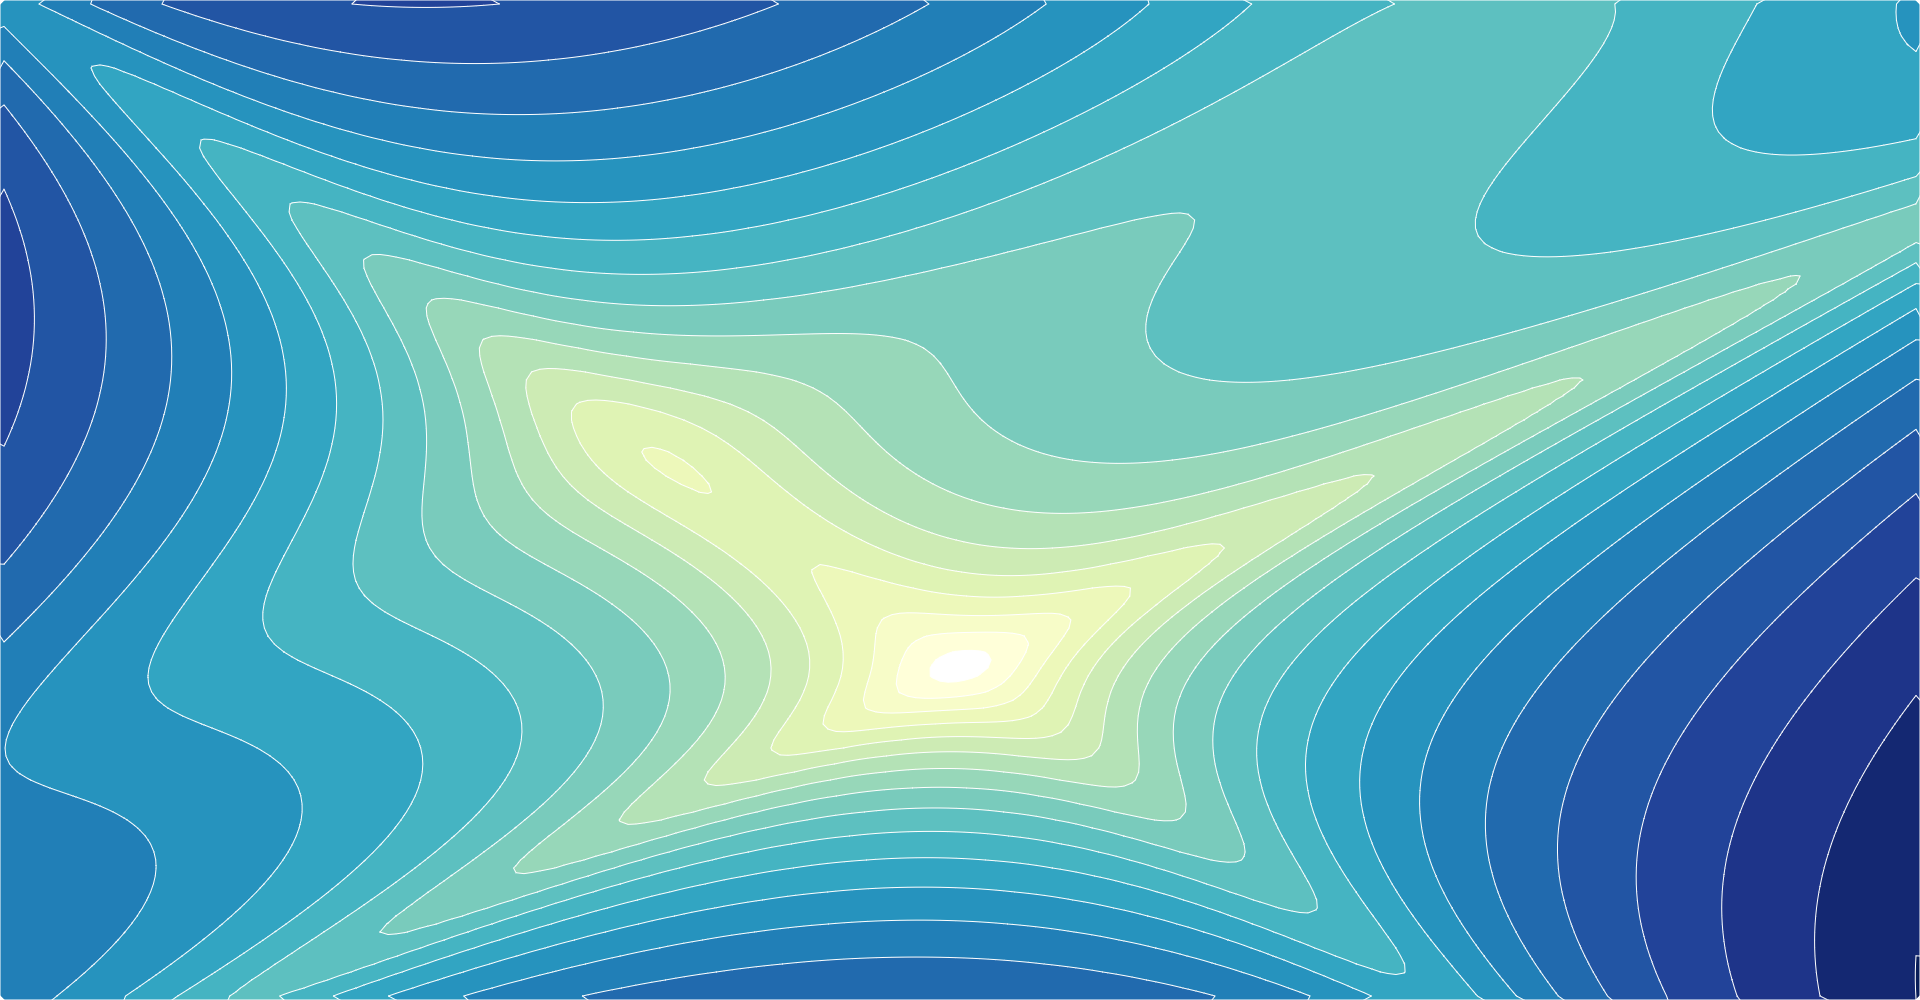
Contour plots can also visualize continuous functions by sampling. Here is the Goldstein–Price function (a test function for global optimization) and a trippy animation of sin(x + y)sin(x - y):
contours()
Examples · Source · Constructs a new contour generator with the default settings.
const contours = d3.contours()
    .size([width, height])
.thresholds([0, 1, 2, 3, 4]);contours(values)
Source · Computes the contours for the given array of values, returning an array of GeoJSON MultiPolygon geometry objects.
const polygons = contours(grid);Each geometry object represents the area where the input values are greater than or equal to the corresponding threshold value; the threshold value for each geometry object is exposed as geometry.value.
The input values must be an array of length n×m where [n, m] is the contour generator’s size; furthermore, each values[i + jn] must represent the value at the position ⟨i, j⟩. For example, to construct a 256×256 grid for the Goldstein–Price function where -2 ≤ x ≤ 2 and -2 ≤ y ≤ 1:
var n = 256, m = 256, values = new Array(n * m);
for (var j = 0.5, k = 0; j < m; ++j) {
  for (var i = 0.5; i < n; ++i, ++k) {
    values[k] = goldsteinPrice(i / n * 4 - 2, 1 - j / m * 3);
  }
}function goldsteinPrice(x, y) {
return (1 + Math.pow(x + y + 1, 2) * (19 - 14 * x + 3 * x * x - 14 * y + 6 * x * x + 3 * y * y))
* (30 + Math.pow(2 * x - 3 * y, 2) * (18 - 32 * x + 12 * x * x + 48 * y - 36 * x * y + 27 * y * y));
}The returned geometry objects are typically passed to geoPath to display, using null or geoIdentity as the associated projection.
contours.contour(values, threshold)
Source · Computes a single contour, returning a GeoJSON MultiPolygon geometry object representing the area where the input values are greater than or equal to the given threshold value; the threshold value for each geometry object is exposed as geometry.value.
The input values must be an array of length n×m where [n, m] is the contour generator’s size; furthermore, each values[i + jn] must represent the value at the position ⟨i, j⟩. See contours for an example.
contours.size(size)
Source · If size is specified, sets the expected size of the input values grid to the contour generator and returns the contour generator. The size is specified as an array [n, m] where n is the number of columns in the grid and m is the number of rows; n and m must be positive integers. If size is not specified, returns the current size which defaults to [1, 1].
contours.smooth(smooth)
Examples · Source · If smooth is specified, sets whether or not the generated contour polygons are smoothed using linear interpolation. If smooth is not specified, returns the current smoothing flag, which defaults to true.
contours.thresholds(thresholds)
Source · If thresholds is specified, sets the threshold generator to the specified function or array and returns this contour generator. If thresholds is not specified, returns the current threshold generator, which by default implements Sturges’ formula.
Thresholds are defined as an array of values [x0, x1, …]. The first generated contour corresponds to the area where the input values are greater than or equal to x0; the second contour corresponds to the area where the input values are greater than or equal to x1, and so on. Thus, there is exactly one generated MultiPolygon geometry object for each specified threshold value; the threshold value is exposed as geometry.value.
If a count is specified instead of an array of thresholds, then the input values’ extent will be uniformly divided into approximately count bins; see ticks.